![]()
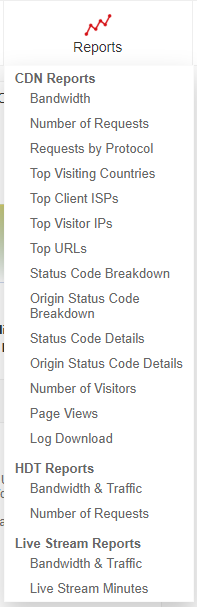
CDN Reports give you information about traffic to your domains. To see them, click Reports from the top menu and select a type of report under CDN Reports.
Fourteen CDN reports are available.
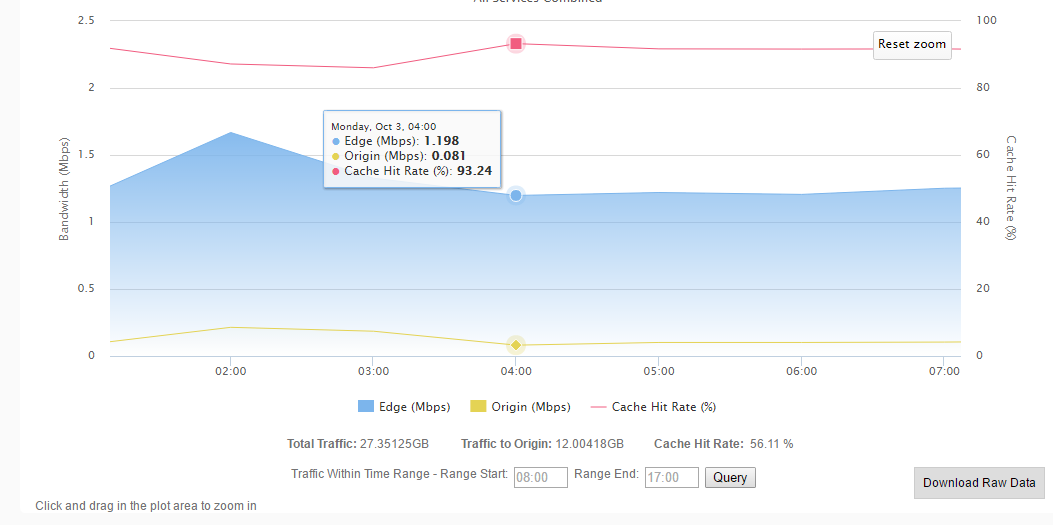
The bandwidth reports show the volume of traffic to your domains with one line representing edge traffic from QUANTIL's servers, one representing traffic from your origin servers, and one representing the cache hit rate.
The vertical (Y) axis shows the bandwidth and hit ratio while the horizontal (X) axis shows time. The cache hit rate is computed as (edge traffic - origin traffic) / edge traffic.
Total traffic and traffic to origin are shown in megabytes, gigabytes (1000 megabytes), or terabytes (1000 gigabytes) depending on the volume to your domains. The overall cache hit rate for the time period also appears. If you choose to view by 5-minute interval, you will also see peak bandwidth and 95% bandwidth values.
The Traffic Within Time Range form gives you the distribution of traffic during particular hours of the day during the entire period defined by the "From" and "To" fields. This lets you find out, for example, total traffic in the evening for a month. Enter the start and end time in HH:mm format (Hours:: minutes). Hours should range from 00 to 23 while minutes range from 00 to 59. For example, 19:00 represents 7pm, and 00:00 represents midnight. Click the Query button to see a chart showing the breakdown of traffic.
This report shows the number of hits or requests made to your domains' files. Lines show the requests to our edge servers, requests to your origin servers, and the cache hit rate. The cache hit rate is computed as (edge requests - origin requests)/edge requests.
This report shows the number of hits or requests made to your domains' files distinguished by protocol. Lines show the HTTP and HTTPS requests.
Top Visiting Countries displays two pie charts showing the most popular countries visiting your domains. One chart orders results by traffic volume while the other orders results by the hits or requests to your domains.
Top Client ISPs displays two pie charts showing the internet service providers (ISPs) of clients visiting your domains. One chart orders results by traffic volume while the other orders results by the hits or requests to your domains.
Top Visitor IPs displays two pie charts showing the most popular IP addresses visiting your domains. One chart orders results by traffic volume while the other orders results by the hits or requests to your domains.
Top URLs displays two pie charts showing the most frequently requested files in your domains. One chart orders results by traffic volume while the other orders results by the hits or requests to your domains.
The Status Code Breakdown report shows the percentage of each HTTP status code returned as a result of requests to your content. For example, the code 200 represents a successful request.
The Origin Status Code Breakdown report shows the percentage of each HTTP status code returned as a result of requests to your origin servers. For example, the code 200 represents a successful request.
The Status Code Details report displays the HTTP status codes returned over time.
The Origin Status Code Details report displays the HTTP status codes returned by your origin servers over time.
The visitor report shows the number of daily visitors to your domain. You must select a specific domain to see this report. Please note that the report will include the total number of visitors during the day even if the time period specified only covers a portion of the day.
The Page View report shows the number of pages viewed in your domains. Each page typically consists of multiple objects, so the number of pages will be smaller than the total number of requests.
Select this option to access the raw logs for your domains. These logs show the requests made for your content. Each log file shows the IP making the request, the date and time of the request, the file requested, the HTTP response code, the number of bytes, the referer, and type of client making the request.
Logs are available for individual domains only. Choose a domain, select the period of logs you wish to download, and click the Query button to see a list of available log files. Click a link to download the log to your computer.
Logs are compressed using gzip compression. Log file names ending in "ov.log.gz" indicate access from locations outside of mainland China while those ending in "cn.log.gz" contain data for mainland China.
Logs are controlled by the Log Storage Days and Domain Time Zone advanced options.
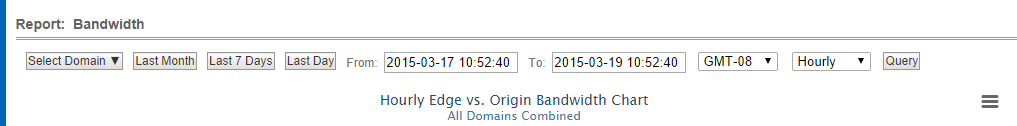
Click Select Domain to change your view of a CDN chart You can choose to see a chart summarizing all domains (the default), all domains of a particular QUANTIL service type, all domains using HTTPS, domains accelerated in particular service areas, or an arbitrary combination of domains and groups.
You can also select the time period to display as well as the interval (daily, hourly, or 5 minutes). Click Query after changing your selection to refresh the chart.
* Please note that when querying hourly or daily intervals, the data for a particular hour or day represents the traffic or requests starting at that hour or day. For example, if querying hourly intervals, then the value at 7pm represents traffic or requests between 7pm and 8pm.
On the other hand, when querying 5-minute intervals, the data for a particular time represents traffic or requests for the five minutes ending at that time.