![]()
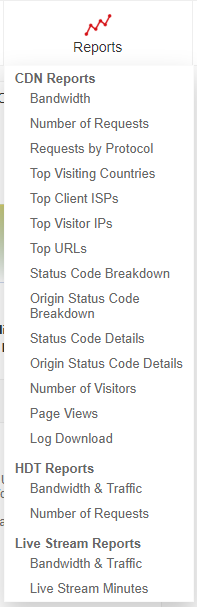
HDT Reports give you information about traffic to your HDT transports. To see them, click Reports from the top menu and select a type of report under HDT Reports.
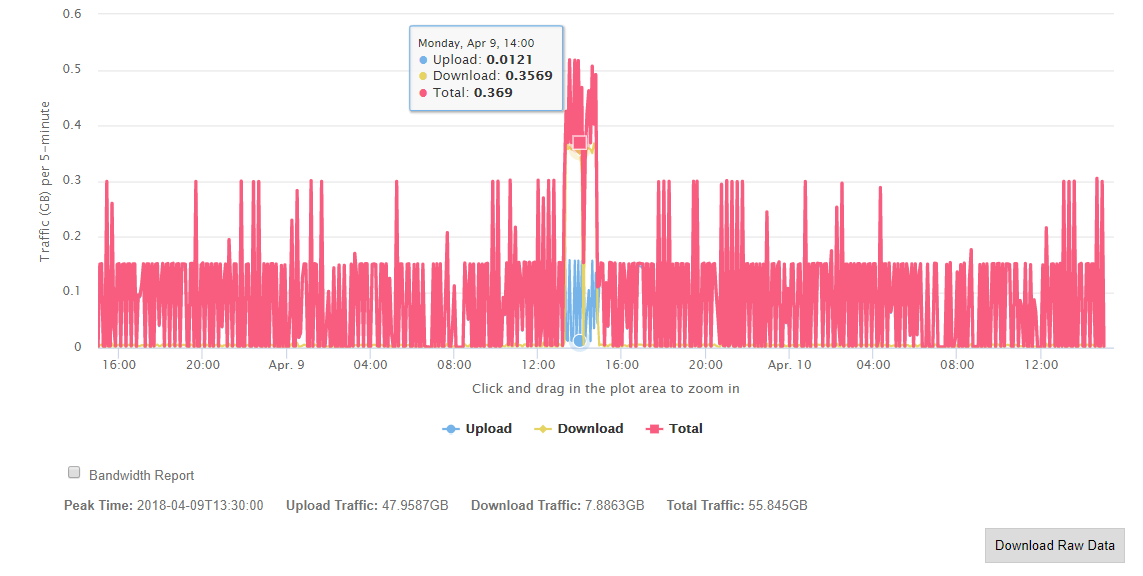
The HDT bandwidth and traffic report shows upload and download traffic to your transports along with peak and average bandwidth during the time period.
This report shows the number of requests using your transports.
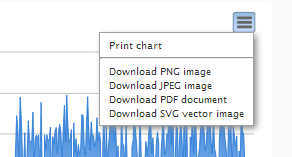
Click Select Transport to change your view of an HDT report. You can choose to see a chart summarizing all transports (the default) or select the transports to include. You can also select the time period to display. Time intervals supported by HDT reports are 1-minute, 5-minutes, hourly, daily, and monthly.
Click Query after changing your selection to refresh the chart.
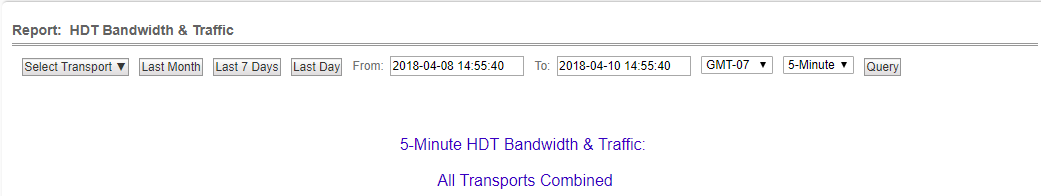
* Please note that when querying hourly or daily intervals, the data for a particular hour or day represents the traffic or requests starting at that hour or day. For example, if querying hourly intervals, then the value at 7pm represents traffic or requests between 7pm and 8pm.
On the other hand, when querying 5-minute intervals, the data for a particular time represents traffic or requests for the five minutes ending at that time.